Today, we’re launching the building block of all financial reporting: a ledger. Journalize Ledgers is the simplest way to record transactions and generate statements. Developers can use our API to get started in minutes, and finance teams can quickly build reports and export data to spreadsheets.
Finance
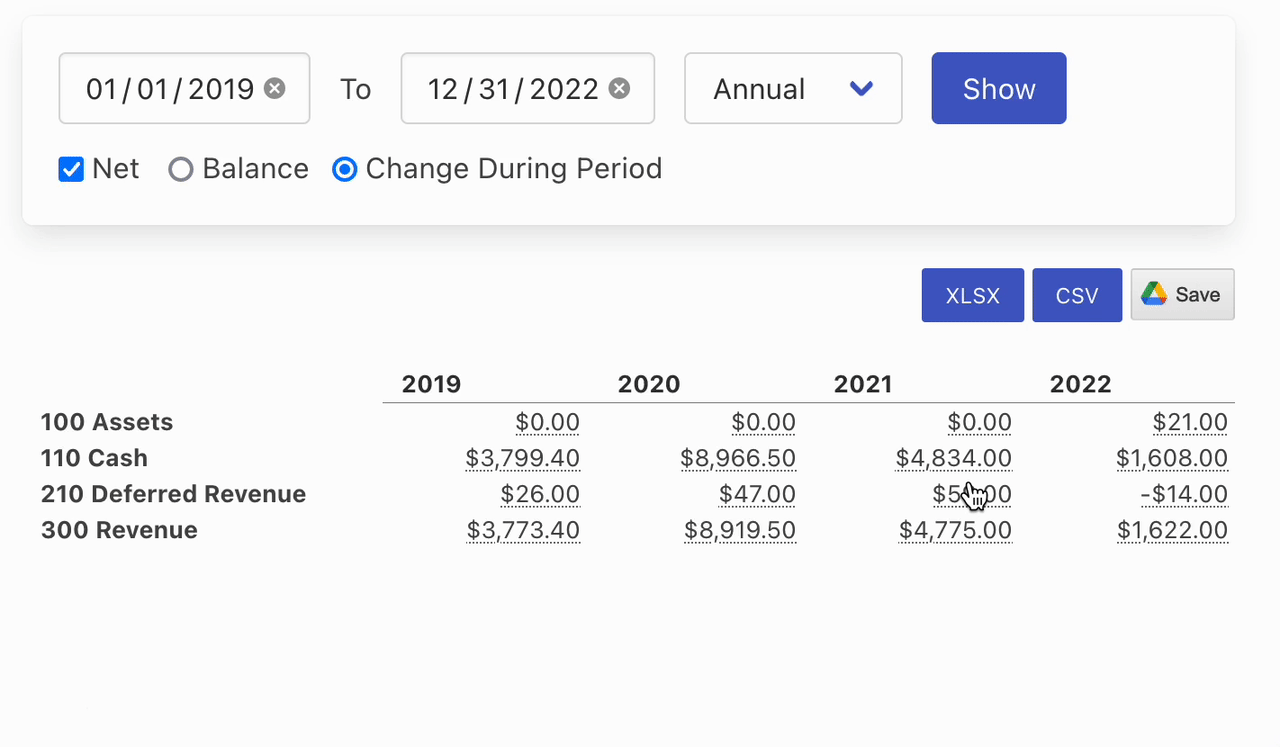
Ledgers were designed for finance teams to build standard financial statements out of the box.
- Select any date range for a report, and view by YTD, QTD, MTD
- Support for hierarchical account numbers, infinte sub-accounts
- View either point-in-time balances or deltas
- One-click export to CSV, Excel, or Google Drive
- Drill down into the specific transactions and see supporting details
- We’ll help import your existing chart of accounts
In the below screenshot, we create a report and then drill down to the specific line items. Every number is fully explainable, and the software does not slow down with a large number of transactions.
Developers
Developers can start recording transactions in minutes via the API: https://api.journalize.io/docs
- Ledger is append-only
- Thorough documentation and OpenAPI spec
- Attach arbitrary key-value data to any transaction for analysis
- API is small - no need to trudge through pages of documentation
Here’s all it takes to add data to the API using Python:
 1transaction = {
 2    "date": "2022-11-01",
 3    "entries": [
 4        {"amount": 10.00, "account_id": "210", "direction": "debit"},
 5        {"amount": 10.00, "account_id": "300", "direction": "credit"},
 6    ],
 7    "tags": [{"order_id": "1123", "sku": "SKU5813"}]
 8}
 9requests.post('https://api.journalize.io/ledger/transaction',
10            json=transaction,
11            headers={'x-api-key': 'your_api_key'})
You can get started immediately by logging into your dashboard. API keys are ready to use, along with examples to copy and paste.